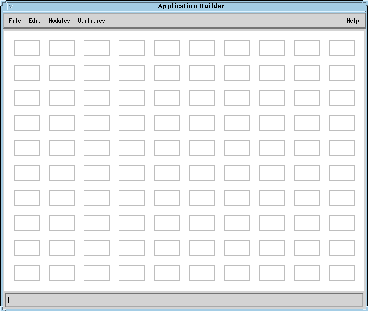
The aim of this tutorial is to help the user building
a simple simulation with CAOS (the "Code for Adaptive Optics Systems").
The example taken here highlights the effect of angular anisoplanatism.
This is in order to practice using the CAOS Application Builder (the graphical
programming environment) together with the Software Package CAOS (the set
of adaptive optics modules).

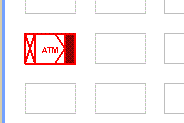
The ATM module generates the turbulent atmosphere layers for the simulation.
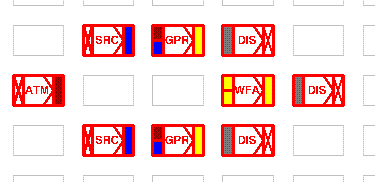
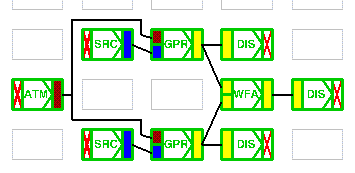
where you have also added some DIS (DISplay) modules to display the wavefronts.
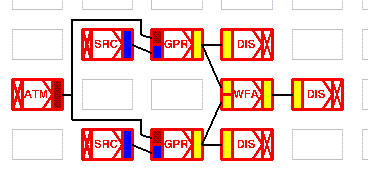
Note that each output accepts more then one link, but each input must
have only one link.
If you want to remove a link, choose "Delete" from the "Edit" menu,
the cursor will change into an up-arrow. Click on the input side of the
module icon related to the link to delete, and the link will disappear.
If you want to delete a module, choose "Delete" as before and click
on the module itself. The module will disappear together with its links
(if any).
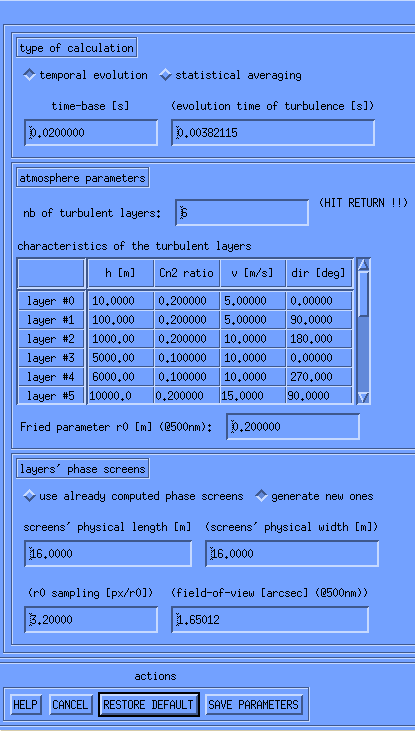
You can see the help of the module for more informations about each item in the GUI (only the left side of the GUI of module ATM is shown here).
The fields having the label enclosed between parenthesis are calculated fields and cannot be modified. They are used to give some useful information to the user.
Select "temporal evolution" in order to simulate time evolving turbulence. The atmosphere will be evolved by the time step set in the "time-base [s]" field for each iteration (at the opposite the "statistical averaging" choice will produce a new independent statistical realisation for each iteration). Set 2 in the box where the "number of turbulent layers" is asked for and hit return. The table of the layer parameter settings change. Edit the height of each layer and the Cn^2 ratio (the fraction of total power associated to the layer - the sum of this column must be equal to 1).
You have for instance:
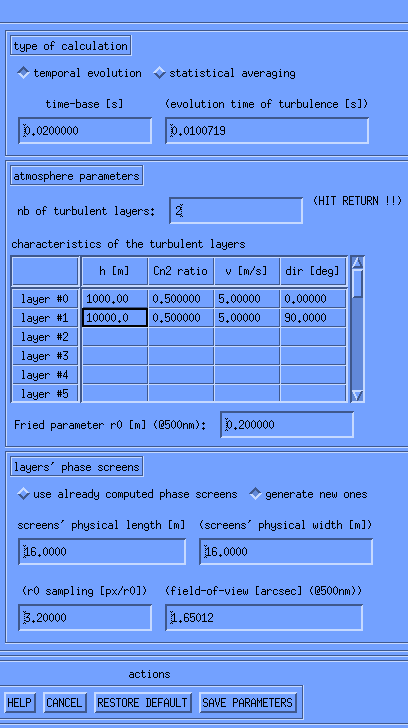
Press the "Save parameters" button.
Now the parameters for ATM are saved in the "./Project/tutorial/" directory, and the outline of the ATM icon changes his color to green. That is to remind you that the parameters for that module have been already set.
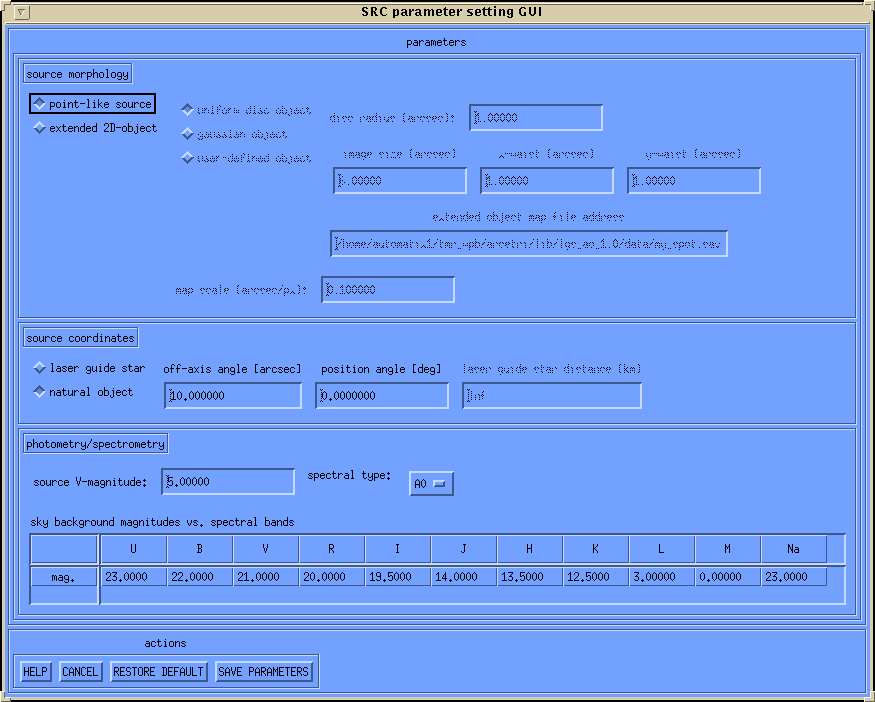
This set an on-axis natural star.
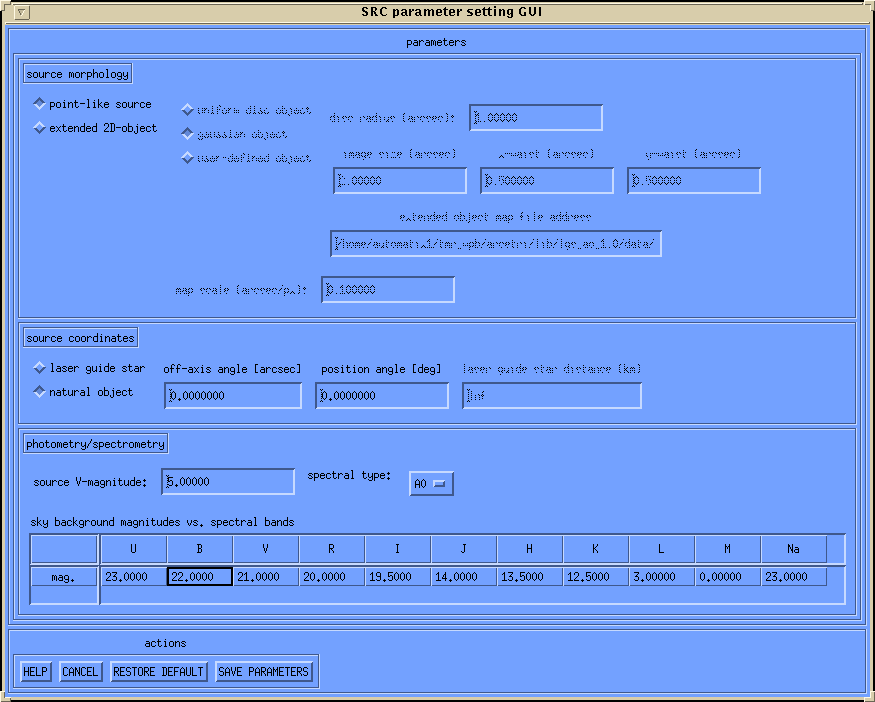
This set an off-axis natural star (10 arcsec far from the previous one).
This set the diameter and the central obscuration of the telescope in order to propagate rays from the first source to the telescope through the atmosphere.
You need to do it a second time in order to define the same telescope
parameters for the propagation of rays from the second source to the telescope.
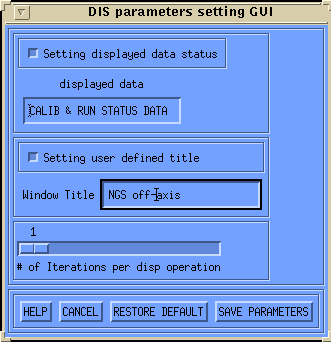
This set the parameters of a display window of the wavefront propagated
from the off-axis NGS. You can set a user-defined title that helps you
keeping track of the different items displayed during the program running.
You need to set-up in the same way the parameters of the other
display modules. After that you need only to input parameters for the wavefront
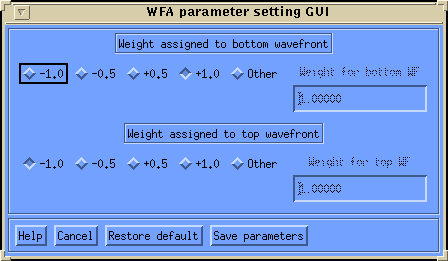
adding module. This is done working on the GUI reported below. Parameters
are set in order to compute the difference between the two wavefronts,
allowing a simple evaluation of the angular anisoplanatism effect.
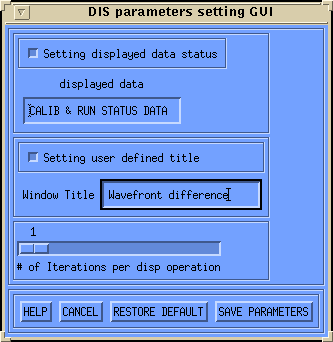
At the end you fix the parameters of the last DIS module that shows the difference between the two wavefronts as displayed below:
You need to save the project every time you want to modify a link, add or remove a module or change the number of iterations, but you don't need to save the project again whenever you change the parameters of a module.
ATTENTION: the project can run even if the CAOS Application Builder is not running. You can close the Application Builder to free some memory and then run the project or you can start a new session of IDL and run a project saved in a previous IDL session without starting again the Application Builder. In all cases always run the command "caos_init" at the IDL prompt before running the project.