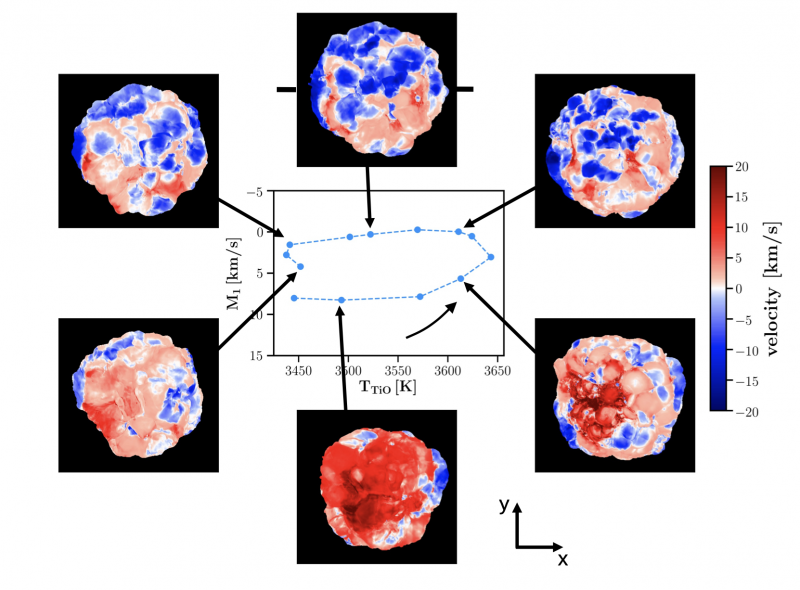
Text pour la Figure: the line-of-sight velocity maps (for an observer located in front of the figure) from radiative hydrodynamics simulations of stellar convection in Red Supergiant stars. Red color corresponds to falling material, and blue color to rising material. The central panel shows the velocity of ascending material as a function of the effective temperature of the star.
Red supergiants are cool massive stars and are the largest and the most luminous stars in the universe. They are characterized by irregular or semi-regular photometric variations, the physics of which is not clearly understood. In this paper, we derived the velocity field in the red supergiant star μ Cep and related it to the photometric variability with the help of the tomographic method. The tomographic method allows to recover the line-of-sight velocity distribution over the stellar disk and within different optical-depth slices. The method is applied to a series of high-resolution spectra of μ Cep, and these results are compared to those obtained from 3D radiative-hydrodynamics CO5BOLD simulations of red supergiants. Fluctuations in the velocity field are compared with photometric and spectroscopic variations, the latter being derived from the TiO band strength and serving (at least partly) a proxy of the variations in effective temperature. We reveals a phase shift between the velocity and spectroscopic/photometric variations. This phase shift results in a hysteresis loop in the temperature – velocity plane (Figure), with a timescale of a few hundred days, similar to the photometric one. The similarity between the hysteresis loop timescale measured in μ Cep and the timescale of acoustic waves disturbing the convective pattern suggests that such waves play an important role in triggering the hysteresis loops.
Work done by Kateryna Kravchenko. Link to the paper: https://ui.adsabs.harvard.edu/abs/2019A%26A...632A..28K/abstract